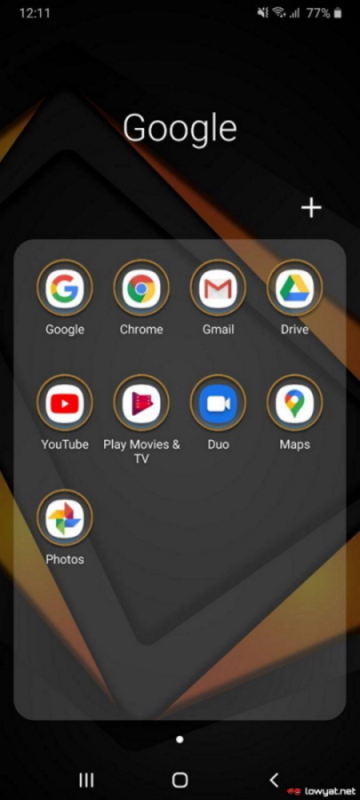
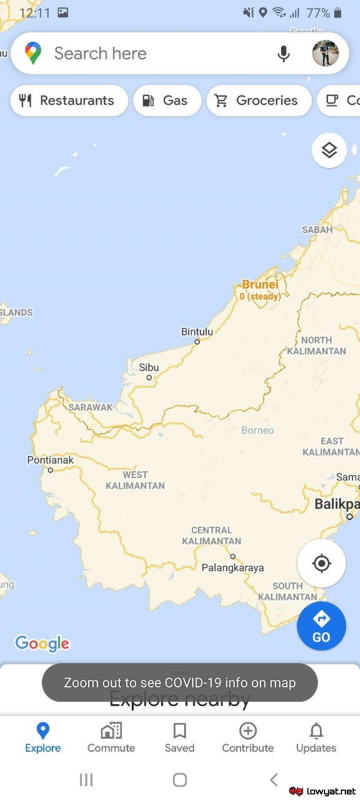
What the new layer generally does is that it provides a quick look into the COVID-19 trends for the areas of the map that users are looking at. According to Google, the number shown represents a seven-day average of new COVID cases per 100,000 people and it will also indicate if the cases in that area are trending up or down. The idea is that users will be able to determine which places to visit and avoid after gaining a better perspective on affected areas via Google Maps. Using a Samsung Galaxy A70, here is a step-by-step guide on how to activate the COVID-19 layer inside the app: Step 1: Launch the Google Maps app.
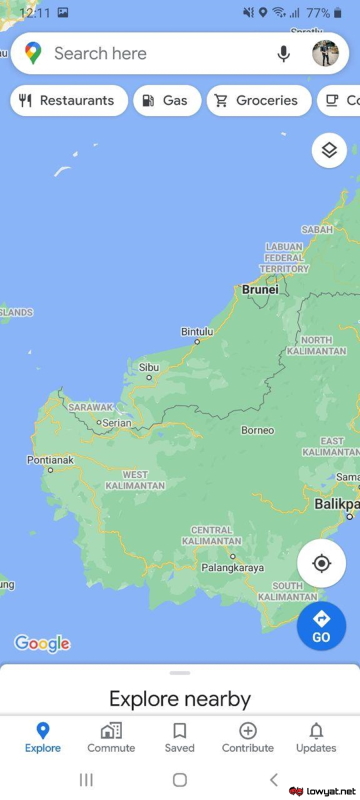
Step 2: Click on the Layer icon found at the right corner of your display.
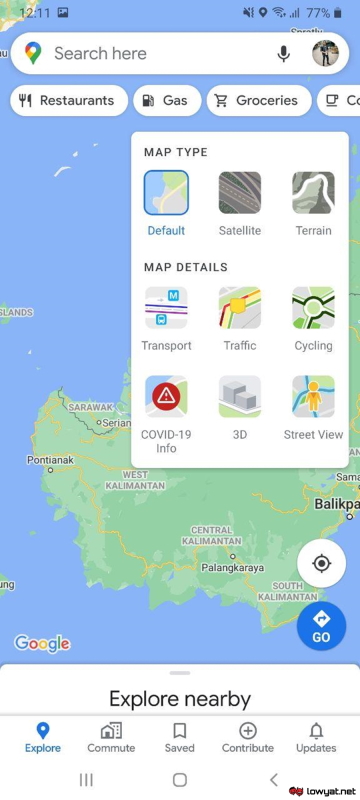
Step 3: Within the Map Details list, tap on COVID-19 Info.
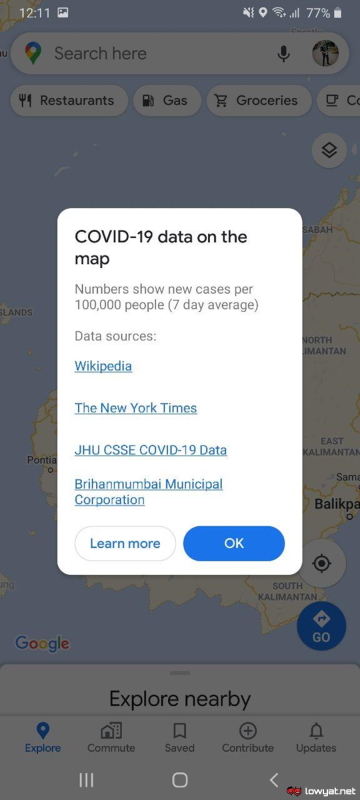
Step 4: Click “OK” after you have received a prompt that lists Google’s data sources for the COVID-19 layer.
Step 5: Tap on the Search bar if you wish to locate specific affected areas (optional)
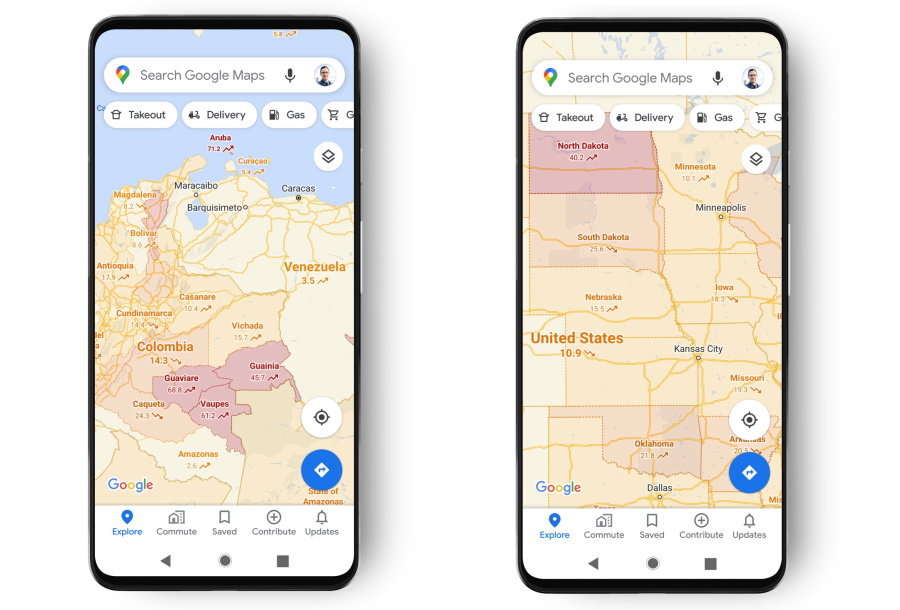
Google has also implemented colour codes ranging from Grey, Yellow, Orange, Dark Orange, Red and Dark Red for COVID-19 which represents the severity of cases within respective areas. However, the depth of the data varies from one location to another though. For example, the data for Malaysia and most of the Southeast Asian countries is country-level basis. In some other markets such as the United States, the statistics shown in the app can be as deep as city-level data.
The new COVID-19 layer for Google Maps has already been rolled out to users throughout the world as we speak, according to Google. So, do keep a look for the arrival of the feature in your iOS and Android devices very soon. (Source: Google)